
- Aug 10, 2026
- 9 min. read
Why More Leads Do Not Always Mean More Revenue
On this page
More leads usually look like good news.
Campaign volume is increasing. Cost per lead is falling. Marketing dashboards are moving in the right direction.
But none of those numbers necessarily mean the business is generating more revenue.
A lead still needs to be qualified, routed to the right person, contacted at the right time, followed up with, and eventually converted into a customer.
If performance is measured only at the top of the funnel, marketing teams can optimize campaigns that look efficient while producing weak business results.
The lead is not the final outcome
Lead generation is one part of a much longer process.
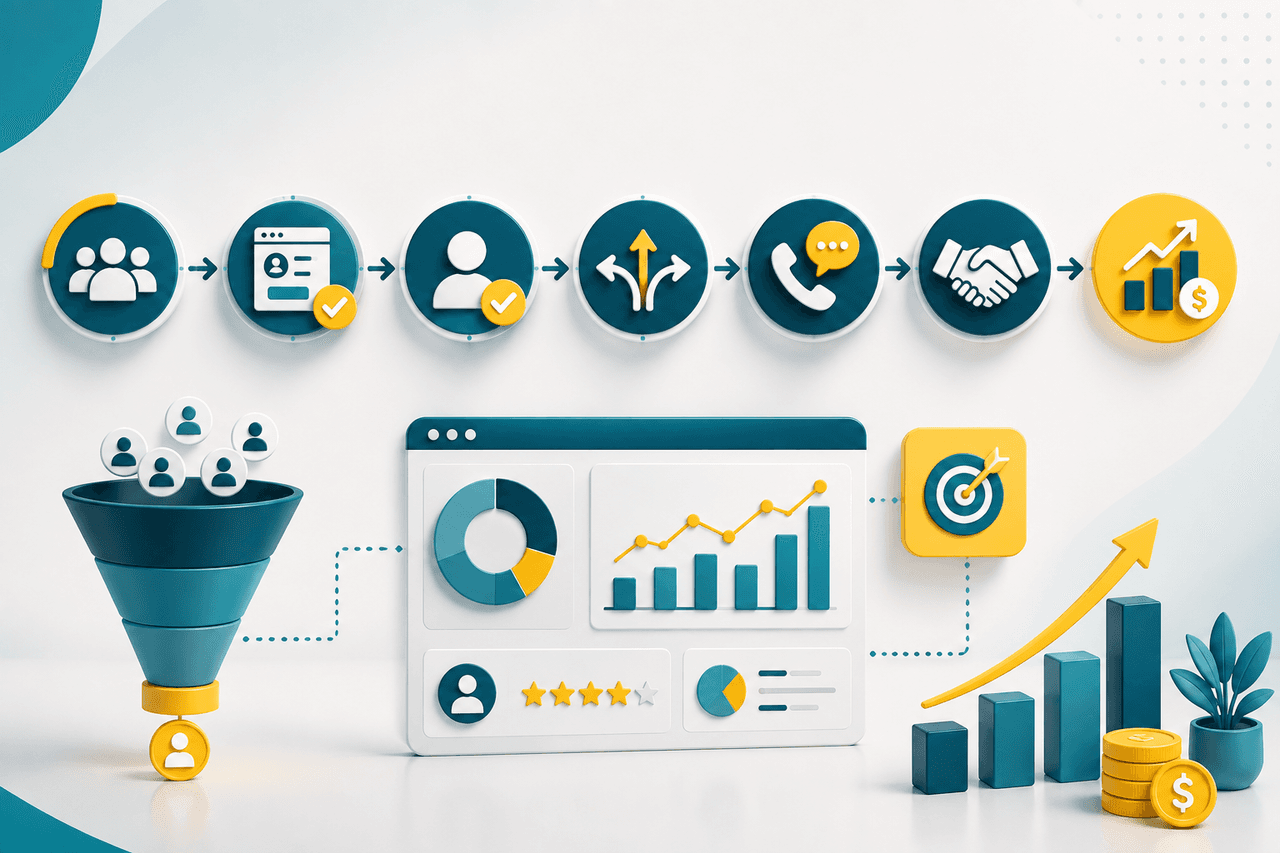
A simplified funnel might look like this:
Marketing controls only part of this journey, but what happens after the lead is generated directly affects the real value of the campaign.
A campaign that generates 1,000 leads is not necessarily better than one generating 500. The smaller campaign may produce more qualified prospects, more conversations, and ultimately more customers.
Key Takeaway
A lead is an intermediate result. The business outcome is what happens after that lead enters the sales process.
Why cost per lead can be misleading
Cost per lead is useful because it provides a simple way to compare acquisition efficiency.
The problem begins when it becomes the main objective.
Imagine two campaigns:
| Metric | Campaign A | Campaign B |
|---|---|---|
| Leads | 1,000 | 600 |
| Cost per lead | $20 | $30 |
| Customers | 20 | 36 |
| Acquisition cost | $1,000 | $500 |
Campaign A appears stronger if the team looks only at lead volume and CPL. Once customer conversion is included, Campaign B tells a very different story.
This is why acquisition metrics should be evaluated together with downstream results.
Lead quality changes the equation
Not every lead represents the same opportunity.
Different channels, campaigns, keywords, audiences, creatives, and landing pages can attract people with very different levels of intent.
A useful performance analysis therefore needs to go beyond counting form submissions.
Teams should understand which sources generate leads that:
- Meet qualification criteria
- Can actually be contacted
- Progress through the sales process
- Convert into customers
- Generate profitable revenue
Once this information is available, marketing optimization becomes much more useful. Budget can move toward the campaigns that produce business outcomes rather than simply inexpensive leads.
What happens after the lead matters
Marketing can generate a strong opportunity and still lose it because of what happens next.
A lead should reach the person or team best positioned to handle it. Geography, product, availability, expertise, capacity, priority, and other business rules may all affect that decision.
A lead that sits untouched in a queue is losing value. The acquisition campaign cannot compensate for an operational process that responds too slowly.
Not every prospect responds to the first call or message. Consistent follow-up across the appropriate channels can be as important as generating the original lead.
When sales teams have more leads than they can handle immediately, they need a way to identify which opportunities deserve attention first.
Why This Matters
Marketing performance and sales operations are connected. Improving acquisition without improving what happens after acquisition can simply create a larger queue of missed opportunities.
Connect marketing data to sales results
To understand true performance, information needs to flow in both directions.
Marketing systems know where the lead came from. Sales and operational systems know what happened afterward.
When those datasets are connected, businesses can answer much more valuable questions:
- Which channels generate the most qualified leads?
- Which campaigns produce the highest conversion rates?
- Which keywords or audiences generate actual customers?
- Which sources have the lowest customer acquisition cost?
- Where are leads being lost after acquisition?
- Which marketing investments generate profitable revenue?
This creates a feedback loop where sales outcomes improve future marketing decisions.
What a useful marketing dashboard should show
A marketing dashboard should make it possible to follow performance from spend to business outcome.
Depending on the business, that can include:
- Acquisition: spend, impressions, clicks, CPC, and conversion rate
- Lead generation: leads, CPL, source, campaign, creative, and keyword
- Qualification: qualified rate and rejection reasons
- Sales activity: contact rate, response time, attempts, and appointments
- Conversion: opportunities, sales, and conversion rate
- Business performance: acquisition cost, revenue, margin, and return on marketing spend
The exact metrics will vary by business. What matters is that measurement does not stop simply because the lead has left the marketing platform.
Common mistakes companies make
Lower CPL can be useful, but not when it comes at the expense of qualification, conversion, or profitability.
Lead sources can produce very different intent and conversion patterns. Volume alone hides those differences.
When acquisition data ends in one system and sales outcomes live in another, teams lose the ability to understand the full funnel.
Sending more leads into an inefficient sales process can increase costs without creating proportional revenue.
Overall performance can hide meaningful differences between channels, campaigns, audiences, products, locations, or sales teams.
Optimize for the business outcome
The purpose of performance marketing is not to generate the largest possible number of leads.
It is to acquire customers efficiently and contribute to profitable growth.
That requires looking beyond advertising platforms and understanding the complete journey from the first click to the final business outcome.
Once marketing, lead management, sales activity, and revenue data are connected, teams can make decisions based on what actually creates value.
More leads do not automatically mean better marketing performance.
Lead quality, routing, response time, follow-up, sales conversion, and acquisition cost all influence what those leads are actually worth to the business.
Marketing performance should not stop at the lead. The closer measurement gets to revenue, the better the decisions become.